An Overview of Apache Superset for Self-Hosted BI
Table of Contents
Abstract
Sooner or later, every data project gets the same request: “Can we have a dashboard for this?”
Commercial tools like Power BI and Tableau do this job well, but their per-user licenses add up quickly. Simple open-source tools are easy to start with, yet many of them keep fine-grained data permissions for their paid plans.
So I spent some time looking at Apache Superset, an open-source BI platform that started at Airbnb and is now a top-level Apache project. In this post, we will look at:
- What Superset is, and what it is not.
- How its main parts work together.
- How one dashboard query moves through the system.
- How Row-Level Security lets many teams share one dashboard.
- When Superset is a good fit, and when another tool is better.
Let’s get started.
The problem
As a product grows, more people want live numbers. Product managers want conversion rates. Sales teams want revenue trends. Operations teams want daily order volume.
We can build custom report pages inside our own app, but that takes developer time for every new chart. Existing BI tools save that time, but they bring two new problems:
- License cost: Many BI tools charge per user. If a hundred people open a dashboard once a week, we still pay for a hundred seats.
- Data control: Some companies can’t send customer data to a third-party cloud because of policy or compliance rules.
Popular open-source tools solve part of this:
- Grafana is excellent for server metrics and logs. It was built around time-series data, so business reports with drill-down tables feel less natural there.
- Metabase is quick to set up and friendly for non-technical users. Its open-source edition is great for simple questions, but row-level data permissions are part of its paid plans.
Superset sits between these options. It’s free under the Apache 2.0 license, runs on our own servers, and includes role-based access and Row-Level Security out of the box.
What is Apache Superset?
The first thing to understand is simple:
Superset is not a database.
Superset doesn’t store our business data. It connects to the databases we already have. When we open a chart, Superset builds a SQL query, sends it to that database, and turns the result into an interactive chart.
Superset talks to databases through SQLAlchemy, a Python library with drivers for many SQL engines. That’s why it works with a long list of systems:
- Transactional databases: PostgreSQL, MySQL, SQL Server, Oracle.
- Data warehouses: ClickHouse, BigQuery, Snowflake, Amazon Redshift, Trino.
- Embedded engines: SQLite, DuckDB.
In practice, if a database speaks SQL and has a SQLAlchemy driver, Superset can usually visualize it.
Here is a sample dashboard from the Superset project. Notice the filter panel on the left. One date range or product filter can update every chart on the page.
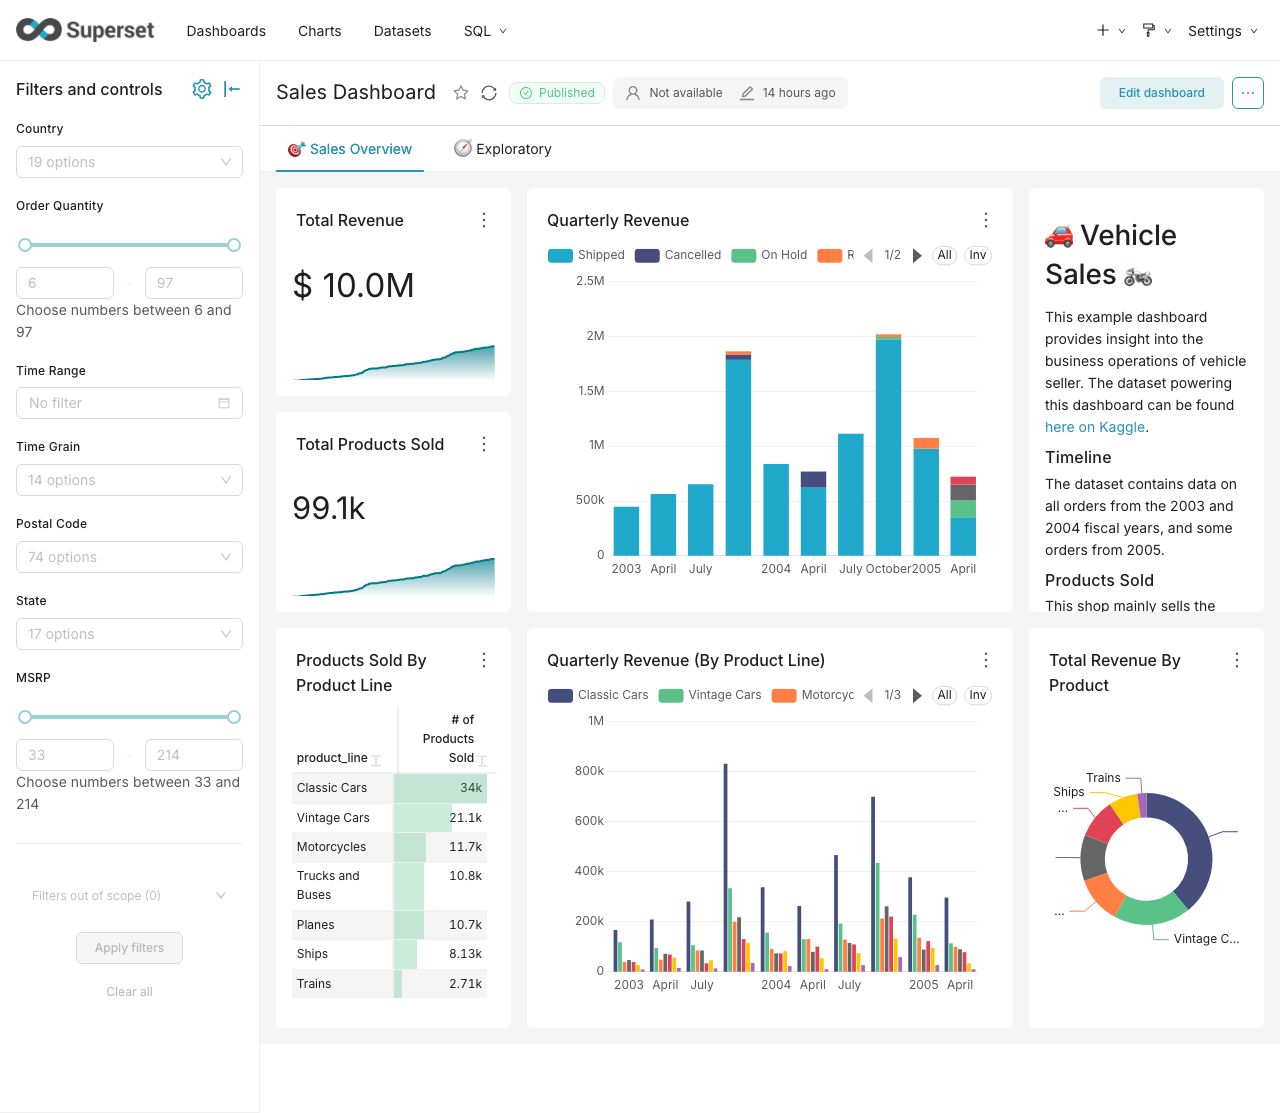
A sample sales dashboard with shared filters (screenshot: Apache Superset project)
How Superset is built
Now that we know what Superset does, let’s look at what runs behind it. A production setup has four main parts:
- React app: The web interface, written in React and TypeScript. Most charts are drawn with Apache ECharts.
- Flask server: The Python backend, built on Flask-AppBuilder. It handles login, permissions, and turns chart settings into SQL.
- Redis and Celery: Redis caches query results. Celery workers run slow jobs in the background, such as long SQL Lab queries and scheduled reports, so the web server stays responsive.
- Metadata database: A PostgreSQL or MySQL database for Superset’s own state: users, roles, chart settings, and dashboard layouts. It doesn’t hold our analytics data.
How a dashboard query moves
To see how these parts work together, let’s follow one request. A user opens a dashboard and changes the date filter.
- Browser: The dashboard sends a chart request to the Flask server.
- Security check: Superset checks the user’s role. If the role can’t access the dataset, the request stops here.
- RLS filters: Superset builds the SQL query and adds any Row-Level Security conditions for that user.
- Your database: The query runs inside your own database, such as PostgreSQL or ClickHouse. Only the result comes back.
- Cache and render: Superset caches the result, so the next matching request can skip the database. The browser then draws the chart.
The key idea is in step 4. Superset doesn’t copy our data into its own engine. The heavy work stays in the database, which is usually the best place for it.
Row-Level Security: One dashboard for every team
Step 3 is the feature that made me take Superset seriously for business reporting.
In most companies, different people need different slices of the same data:
- The national director sees sales for the whole country.
- The North manager sees only the North region.
- The South manager sees only the South region.
Without Row-Level Security (RLS), we usually build three copies of the dashboard or add permission logic in our own code. With Superset, we build one dashboard and add an RLS rule to each role:
- Role
North Manager:region = 'North' - Role
South Manager:region = 'South'
The national director’s role has no rule, so it sees every row. Here is how the same chart query splits by role:
When the North manager opens the dashboard, Superset changes the query before it reaches the database:
-- The query behind the chart:
SELECT SUM(revenue) FROM sales_data;

-- What Superset sends for the North Manager role:
SELECT SUM(revenue) FROM sales_data WHERE region = 'North';
The North manager never receives rows from other regions, because the filter is part of the query itself.
RLS_IN_SQLLAB feature flag is enabled. If a role must never see other rows, turn on that flag or don’t give the role SQL Lab access.
Try it locally
The quickest way to try Superset is Docker Compose. These commands follow the official quickstart:
git clone https://github.com/apache/superset
cd superset

# Use the latest official release tag from the quickstart page
git checkout tags/6.0.0

docker compose -f docker-compose-image-tag.yml up
When the logs settle, open http://localhost:8088 and sign in with admin / admin. The setup also loads sample datasets, so we can explore right away.
Inside, there are two main ways to build charts. Both end in the same place: a saved chart on a dashboard.
Explore: build charts without SQL
In Explore, we pick a dataset, choose metrics and dimensions, and preview the chart. It suits people who know the data but don’t want to write SQL.
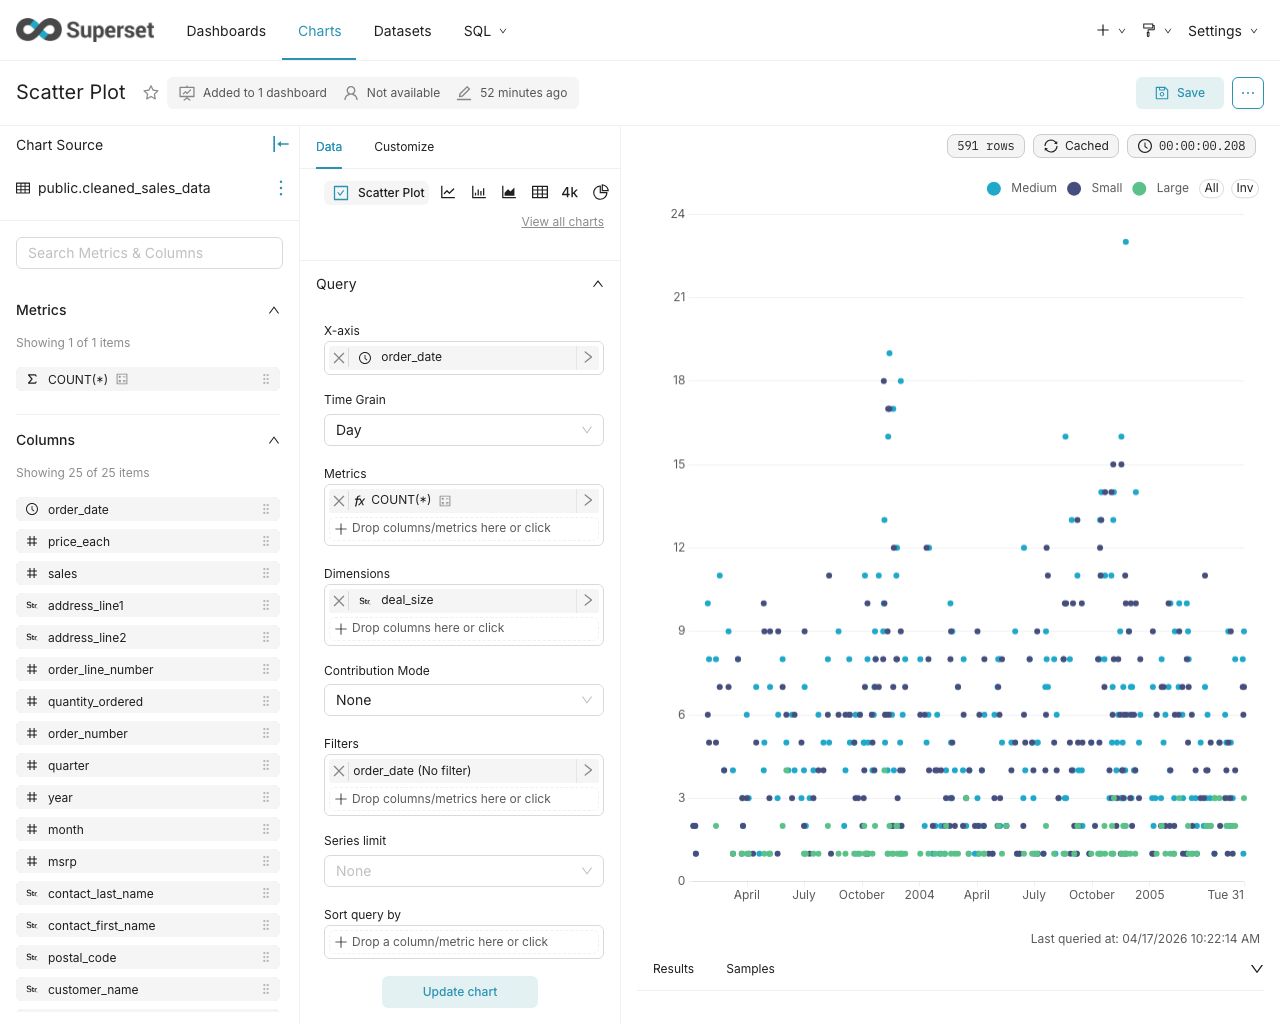
Explore: pick metrics and dimensions, then update the chart (screenshot: Apache Superset project)
SQL Lab: write the query yourself
SQL Lab is a SQL editor inside Superset. It has tabs, a schema browser, and query history. We can also save a query as a virtual dataset and build charts on top of it.
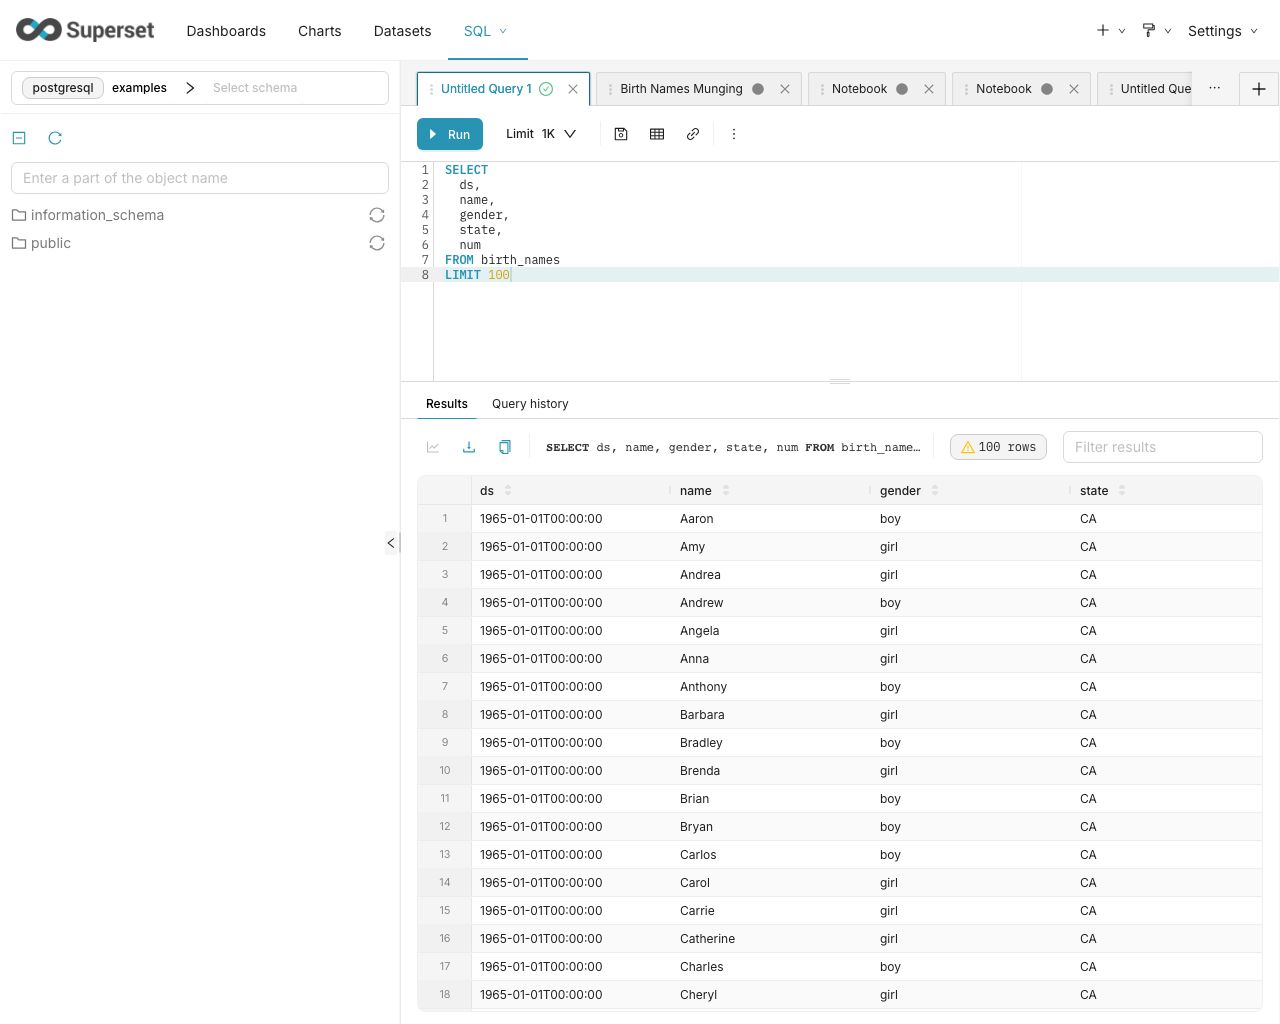
SQL Lab: run queries and browse tables (screenshot: Apache Superset project)
How Superset compares with other tools
Every tool has a sweet spot. Here is how I see the main differences:
| Apache Superset | Metabase | Grafana | Power BI / Tableau | |
|---|---|---|---|---|
| Cost | Free, Apache 2.0 | Free open-source edition; paid plans | Free open-source edition; paid plans | Paid per-user licenses |
| Setup | Medium: app, metadata DB, Redis, workers | Low: one container | Low: one container | Low in the cloud; more work on-premises |
| Where queries run | In your database | In your database | In your data source | Imported into its own engine, or a live connection |
| Query tools | SQL Lab, optional Jinja templates | Visual builder and SQL editor | Per-source query editors, such as PromQL | DAX and Power Query in Power BI, calculations in Tableau |
| Row-level access | Built in and free | Paid plans | Not its focus | Supported |
| Best fit | Teams with data engineers and existing databases | Small teams that want quick answers | Infrastructure and app monitoring | Business teams already in the Microsoft or Salesforce world |
In short:
- For quick charts from one database with little setup, Metabase is faster to start.
- For servers, API latency, and logs, Grafana is the natural choice.
- For teams that already work in Excel and Microsoft 365, Power BI fits their workflow.
- For a self-hosted BI platform with row-level permissions and no per-user fees, Superset is a strong choice.
When should you choose Superset?
Choose Superset when:
- Your team can run Docker or Kubernetes.
- Your data already lives in a SQL database or data warehouse.
- Your data must stay on your own infrastructure.
- Different roles need to see different rows of the same data.
Skip it when:
- Nobody on the team can maintain a metadata database, Redis, and workers.
- You only need infrastructure monitoring.
- Your users want a spreadsheet-style tool more than SQL-based dashboards.
Conclusion
Superset isn’t the easiest BI tool to run. It needs some DevOps work. In return, we keep full control of our data, avoid per-user license costs, and get Row-Level Security without a paid plan.
For me, the most useful idea is that Superset stays a thin layer on top of the database. The database does the heavy work, and Superset focuses on permissions, caching, and charts.
What’s next?
In the next posts of this series, we will get hands-on:
- Build a custom Docker setup with ClickHouse and PostgreSQL drivers.
- Design a first business dashboard with cross-filters.
- Send scheduled report snapshots to email and Slack.
References
Here are the official documents and resources used in this post:
Official documentation
- Apache Superset — Official website: Project overview and the sample screenshots used in this post.
- Apache Superset — GitHub repository: Source code, Docker Compose files, and release tags.
- Apache Superset — Quickstart: Docker Compose steps, default login, and the production warning.
- Apache Superset — Configuring Superset: Metadata database options and feature flags.
- Apache Superset — Security configurations: Roles, Row-Level Security, and the
RLS_IN_SQLLABflag. - Apache Superset — Async queries via Celery: How Celery workers run long queries.
- Apache Superset — Caching: Cache backends such as Redis.
- SQLAlchemy — Dialects: How SQLAlchemy connects to different databases.
- Flask-AppBuilder documentation: The security and app framework behind the Superset backend.
- Apache ECharts: The main charting library in the Superset frontend.
Other tools in the comparison
- Metabase — Pricing: Open-source edition and paid plans.
- Grafana — Open source: Grafana’s open-source edition.
- Microsoft Learn — Row-level security with Power BI: RLS in Power BI.
Disclaimer and product attribution
Happy coding!
Posts in this Series
Support My Work
If you enjoyed this article or found it helpful for your development journey, consider buying me a coffee. Your support fuels more in-depth technical posts and open-source projects!