TTBDebugPlus macOS Debugger
A professional-grade macOS companion app for debugging iOS applications in real-time. View logs, inspect network requests, export to Postman, analyze API performance, and manage debug sessions — all from your Mac.
How It Works
TTBDebugPlus uses Bonjour (mDNS) for zero-configuration discovery and WebSocket for real-time, bidirectional communication between your iOS app and macOS.
🎬 Live Action
See TTBDebugPlus in action. Real debugging sessions captured as animated demos — console logs streaming, network requests inspected, and API analytics in real-time.
Console & Integration Guide
Real-time console log streaming from iOS to macOS. Filter by level, search with highlight, expand JSON payloads, and auto-scroll LIVE mode. Supports Error, Warning, Info, and Debug levels with color-coded output.
Network Inspector & API Analytics
Full network request lifecycle — JSON Tree Viewer with Pretty/Tree/Raw modes, Deep Search by URL/Body/Headers, Pin/Bookmark requests, waterfall timing bars, and one-click export as cURL or Postman Collection v2.1.
💡 GIFs show actual TTBDebugPlus sessions — what you see is what you get.
Powerful Features
Everything you need to debug, inspect, and optimize your iOS applications from macOS.
Live Console
Real-time log streaming- ✓ Filter by level: Error, Warning, Info, Debug
- ✓ Full-text search with highlight matching
- ✓ Click to expand JSON payload details
- ✓ Auto-scroll LIVE mode
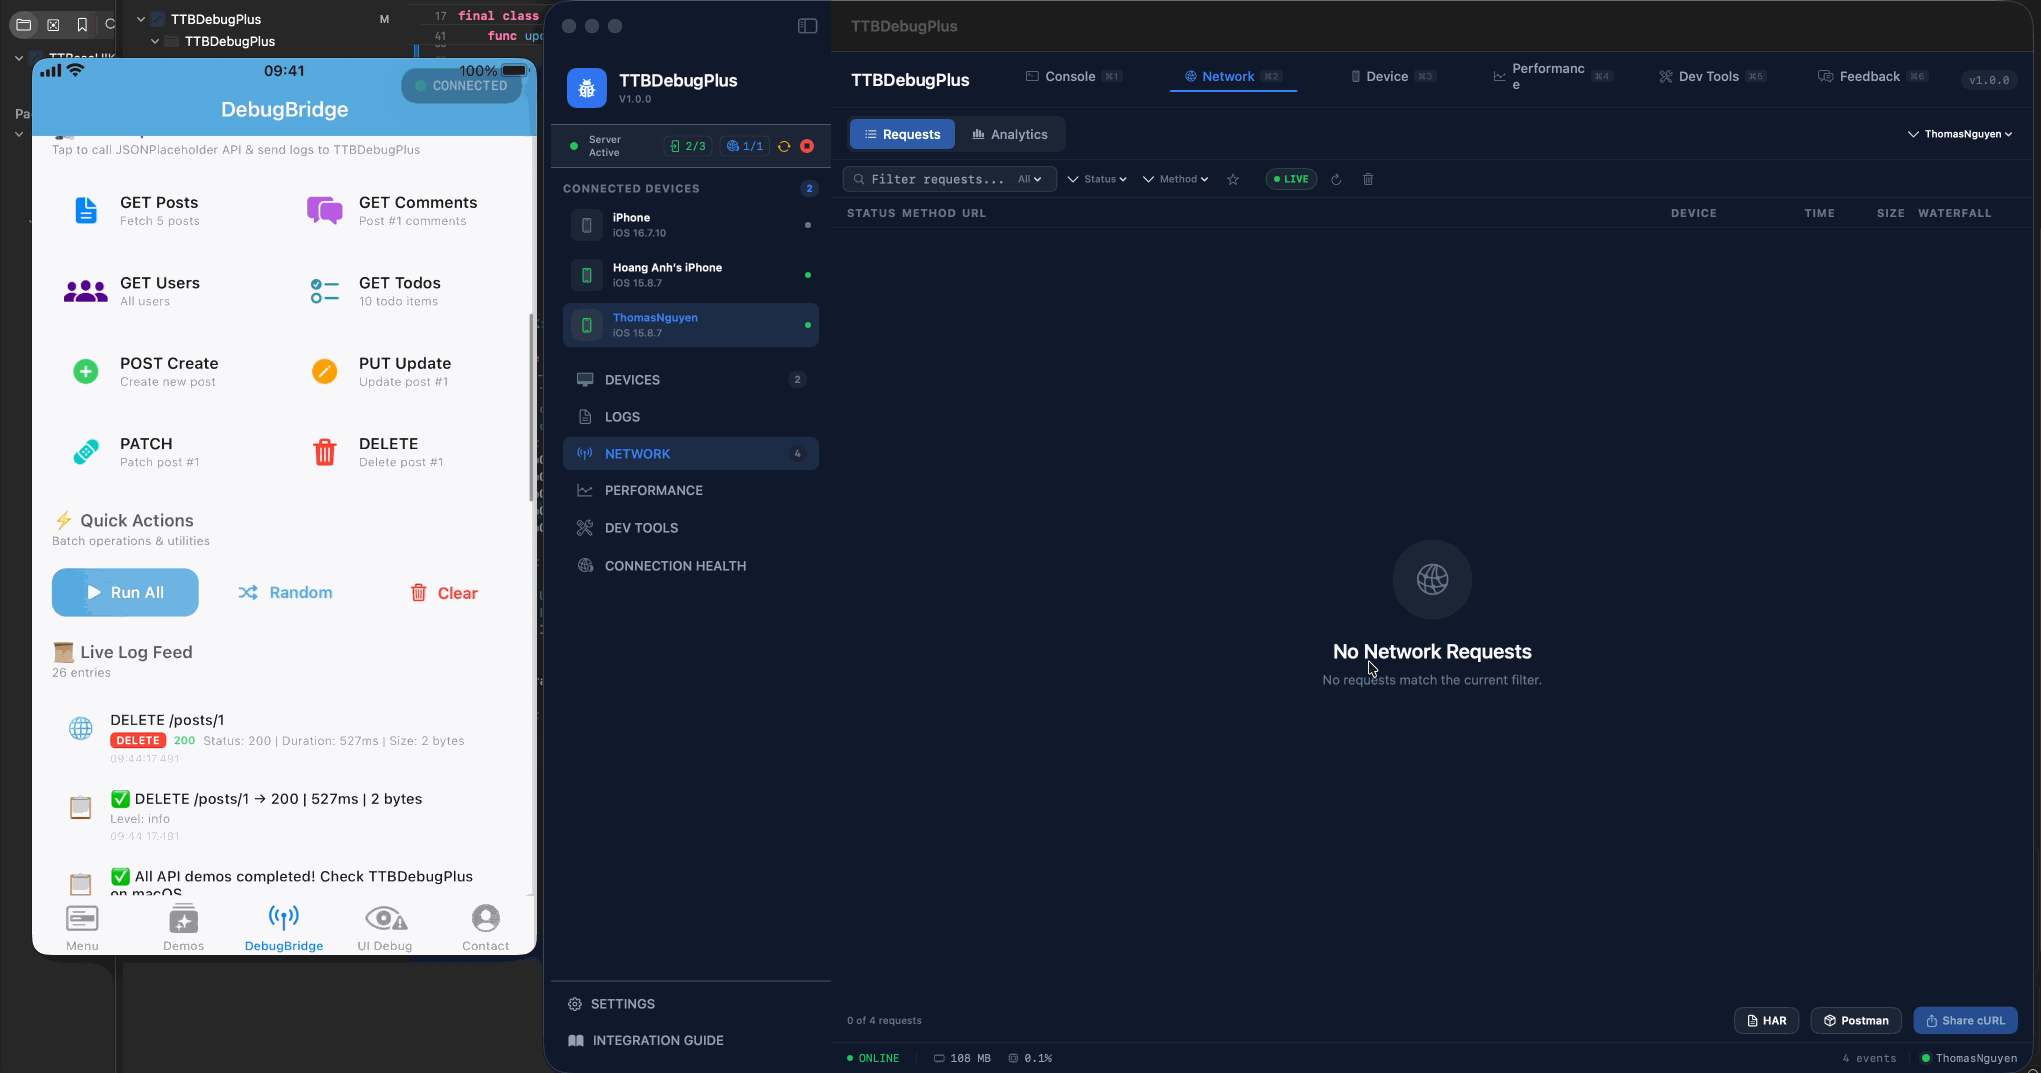
Network Inspector v2
Charles Proxy alternative- ✓ JSON Tree Viewer — collapsible nodes, Pretty/Tree/Raw modes
- ✓ Deep Search — filter by URL, Body, Headers scopes
- ✓ Pin/Bookmark ⭐ requests, waterfall timing bars
- ✓ Export as cURL, Postman Collection (v2.1), context menus
- ✓ API Analytics Dashboard — method/status distribution, slowest requests
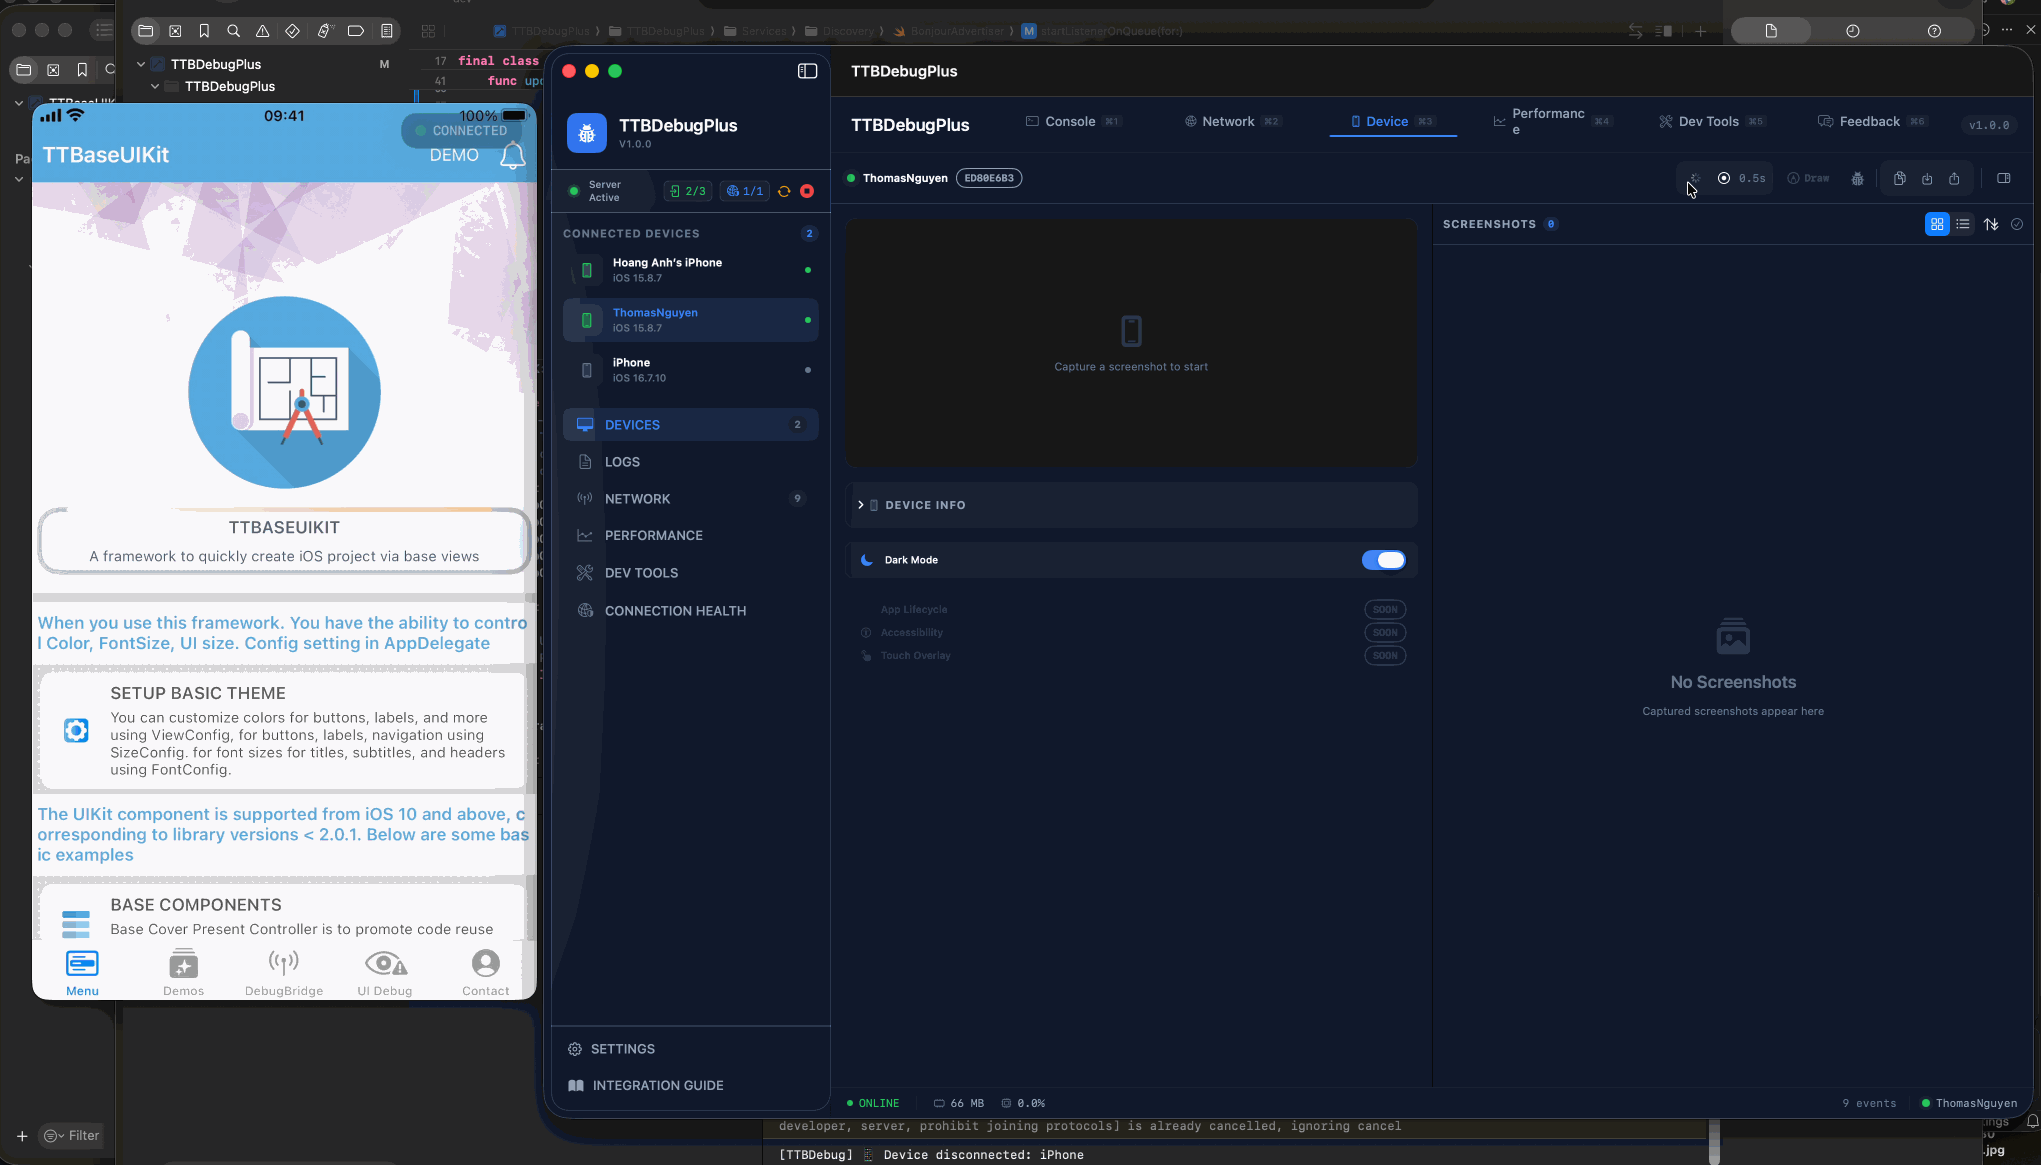
Device Control
Remote device management- ✓ Remote screenshot capture & recording
- ✓ Toggle Dark Mode, Reduced Motion
- ✓ App lifecycle: Launch, Kill, Reset Sandbox
- ✓ Accessibility overrides
Performance Monitor
Real-time metrics- ✓ CPU & Memory usage charts
- ✓ FPS counter and disk usage
- ✓ Network bandwidth monitoring
- ✓ Slow request & duplicate detection
Feedback Reporter
Bug report workflow- ✓ Create structured bug reports
- ✓ Auto-tag: UI/UX, Network, Crash
- ✓ Attach annotated screenshots
- ✓ Export as Markdown
Export & Share v2
Multiple formats- ✓ Postman Collection v2.1 — one-click import
- ✓ cURL for Terminal replay
- ✓ Session files (.ttbdebug) — share debug sessions
- ✓ Import/Export sessions between team members
- ✓ Context menu: copy URL, headers, body, JSON payload
See It In Action
A professional-grade macOS interface built entirely with SwiftUI. Dark theme, polished UI, zero compromise.
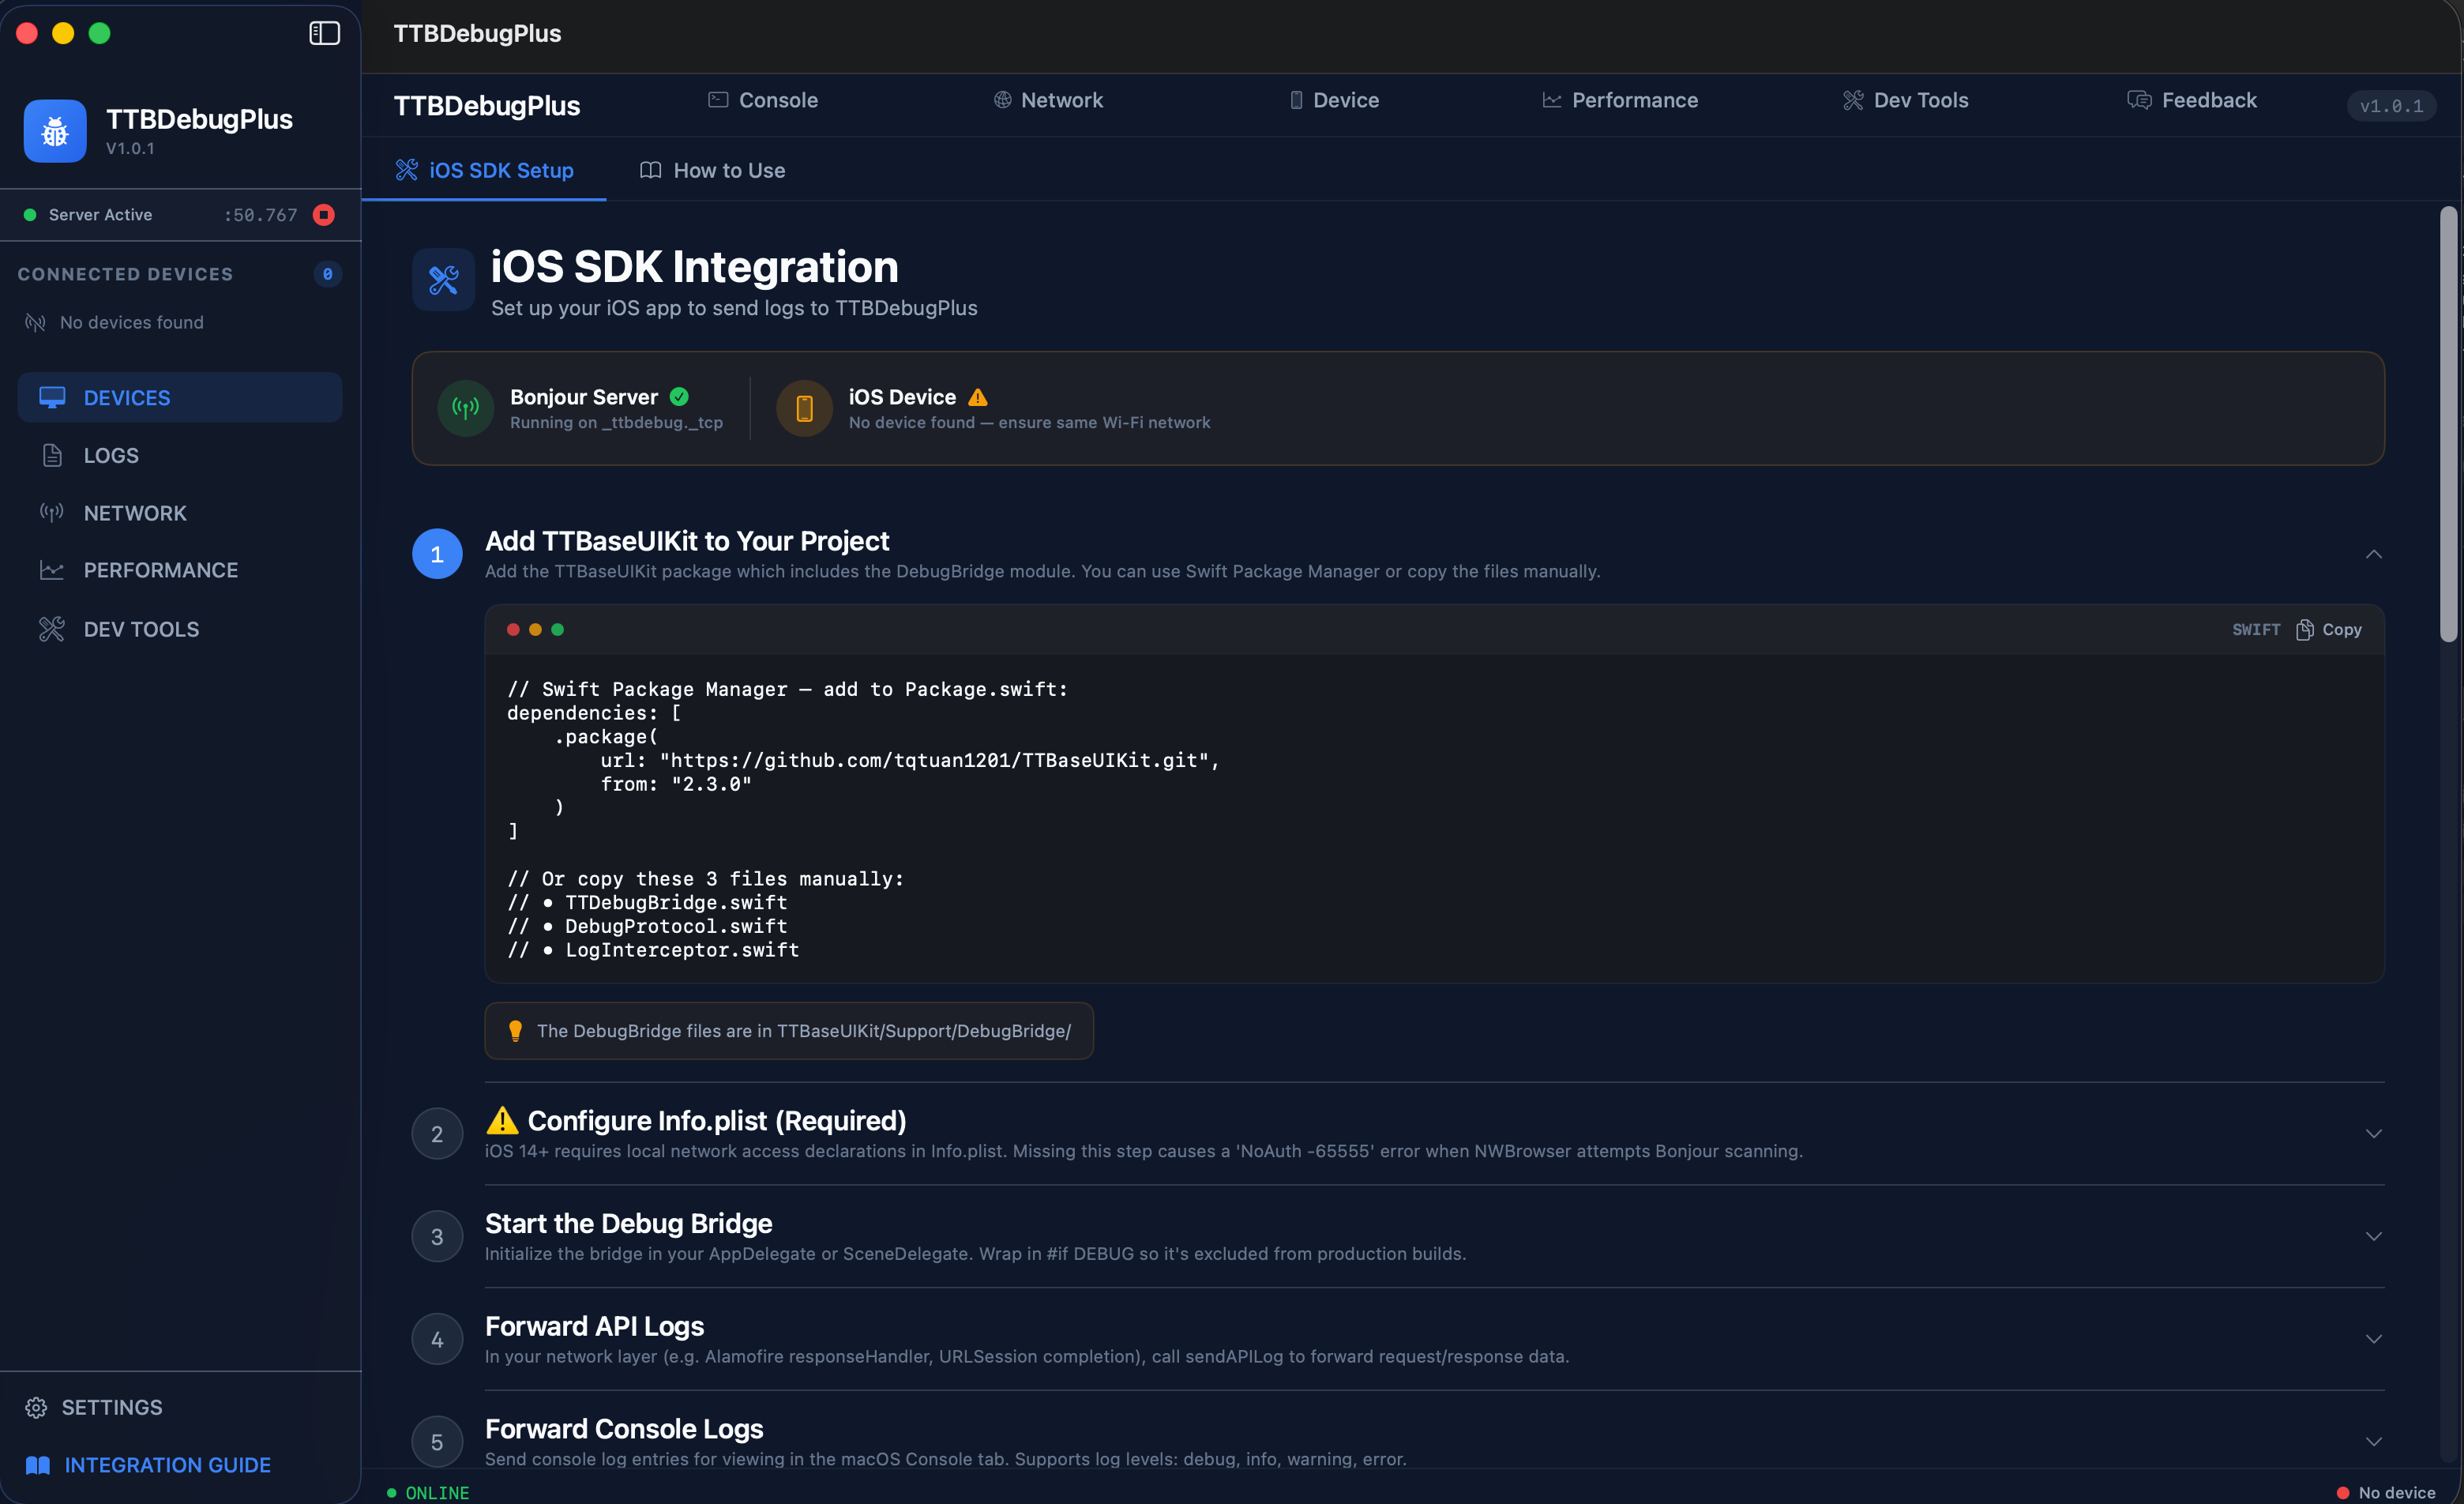
🚀 iOS SDK Integration
Step-by-step setup guide with copyable code snippets, Bonjour status, and troubleshooting — all inside the app.
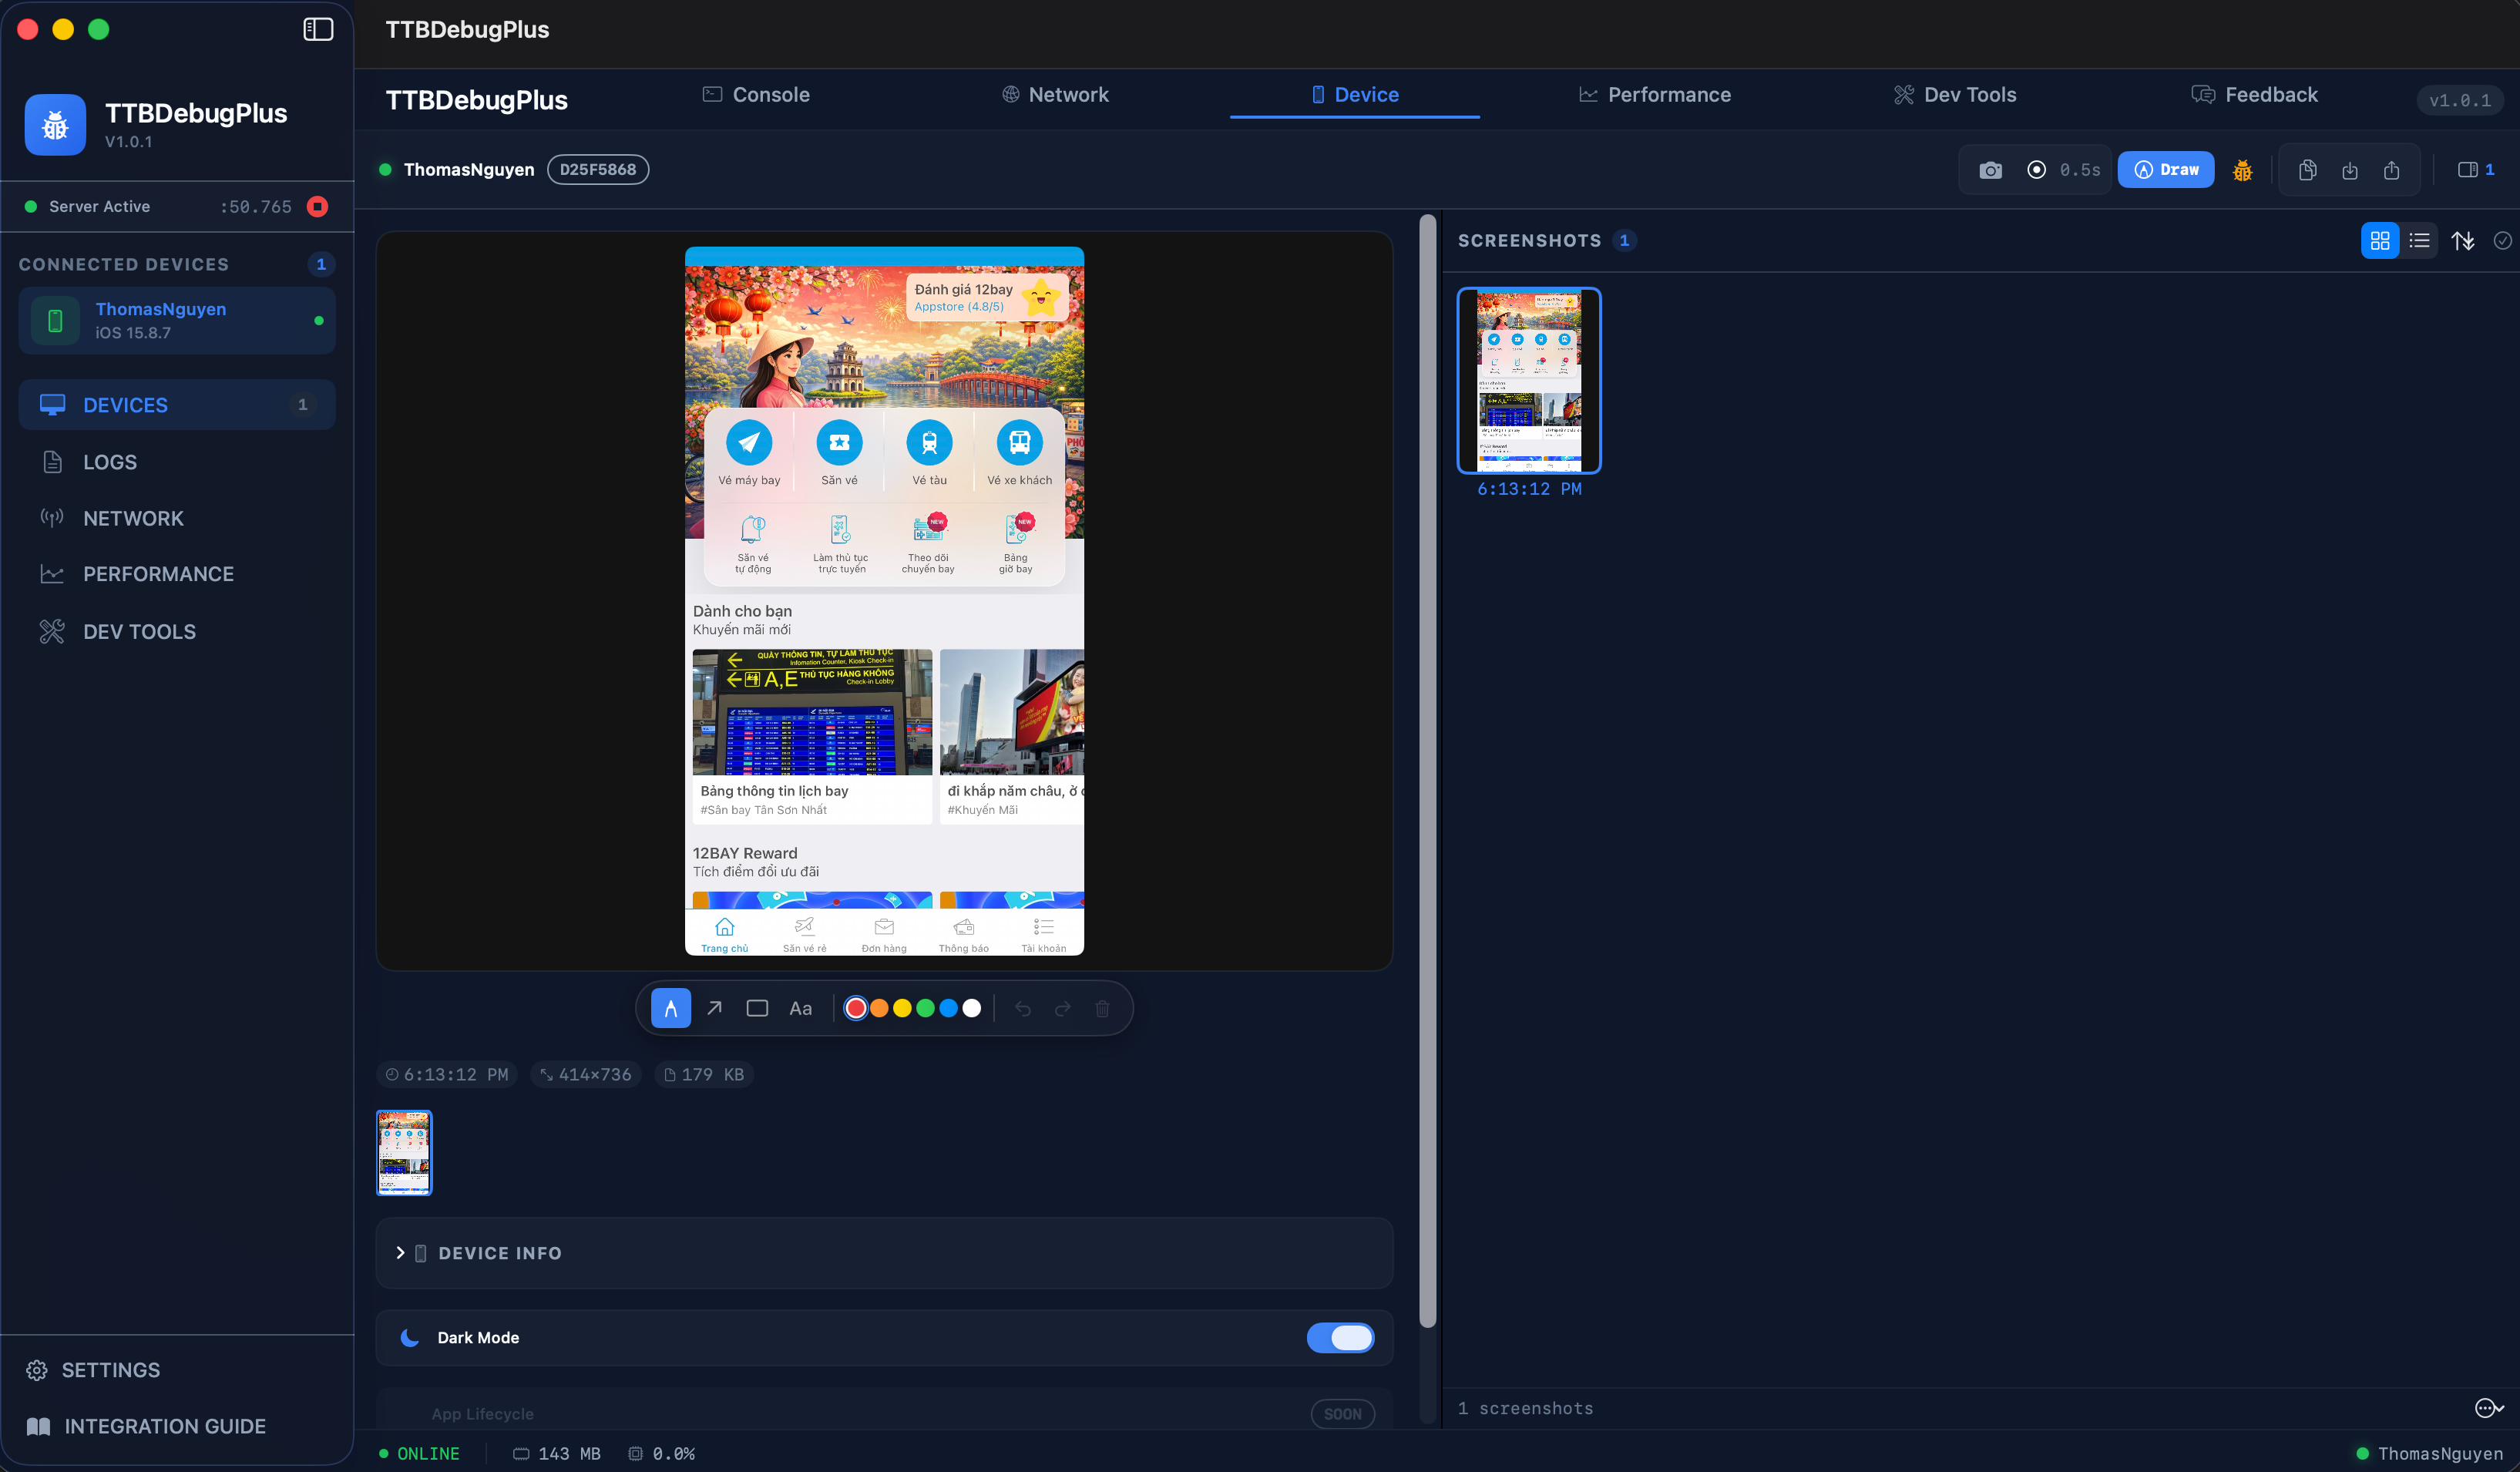
📱 Device Control
Remote screenshot capture, screenshot gallery, dark mode toggle, device info, and app lifecycle management.
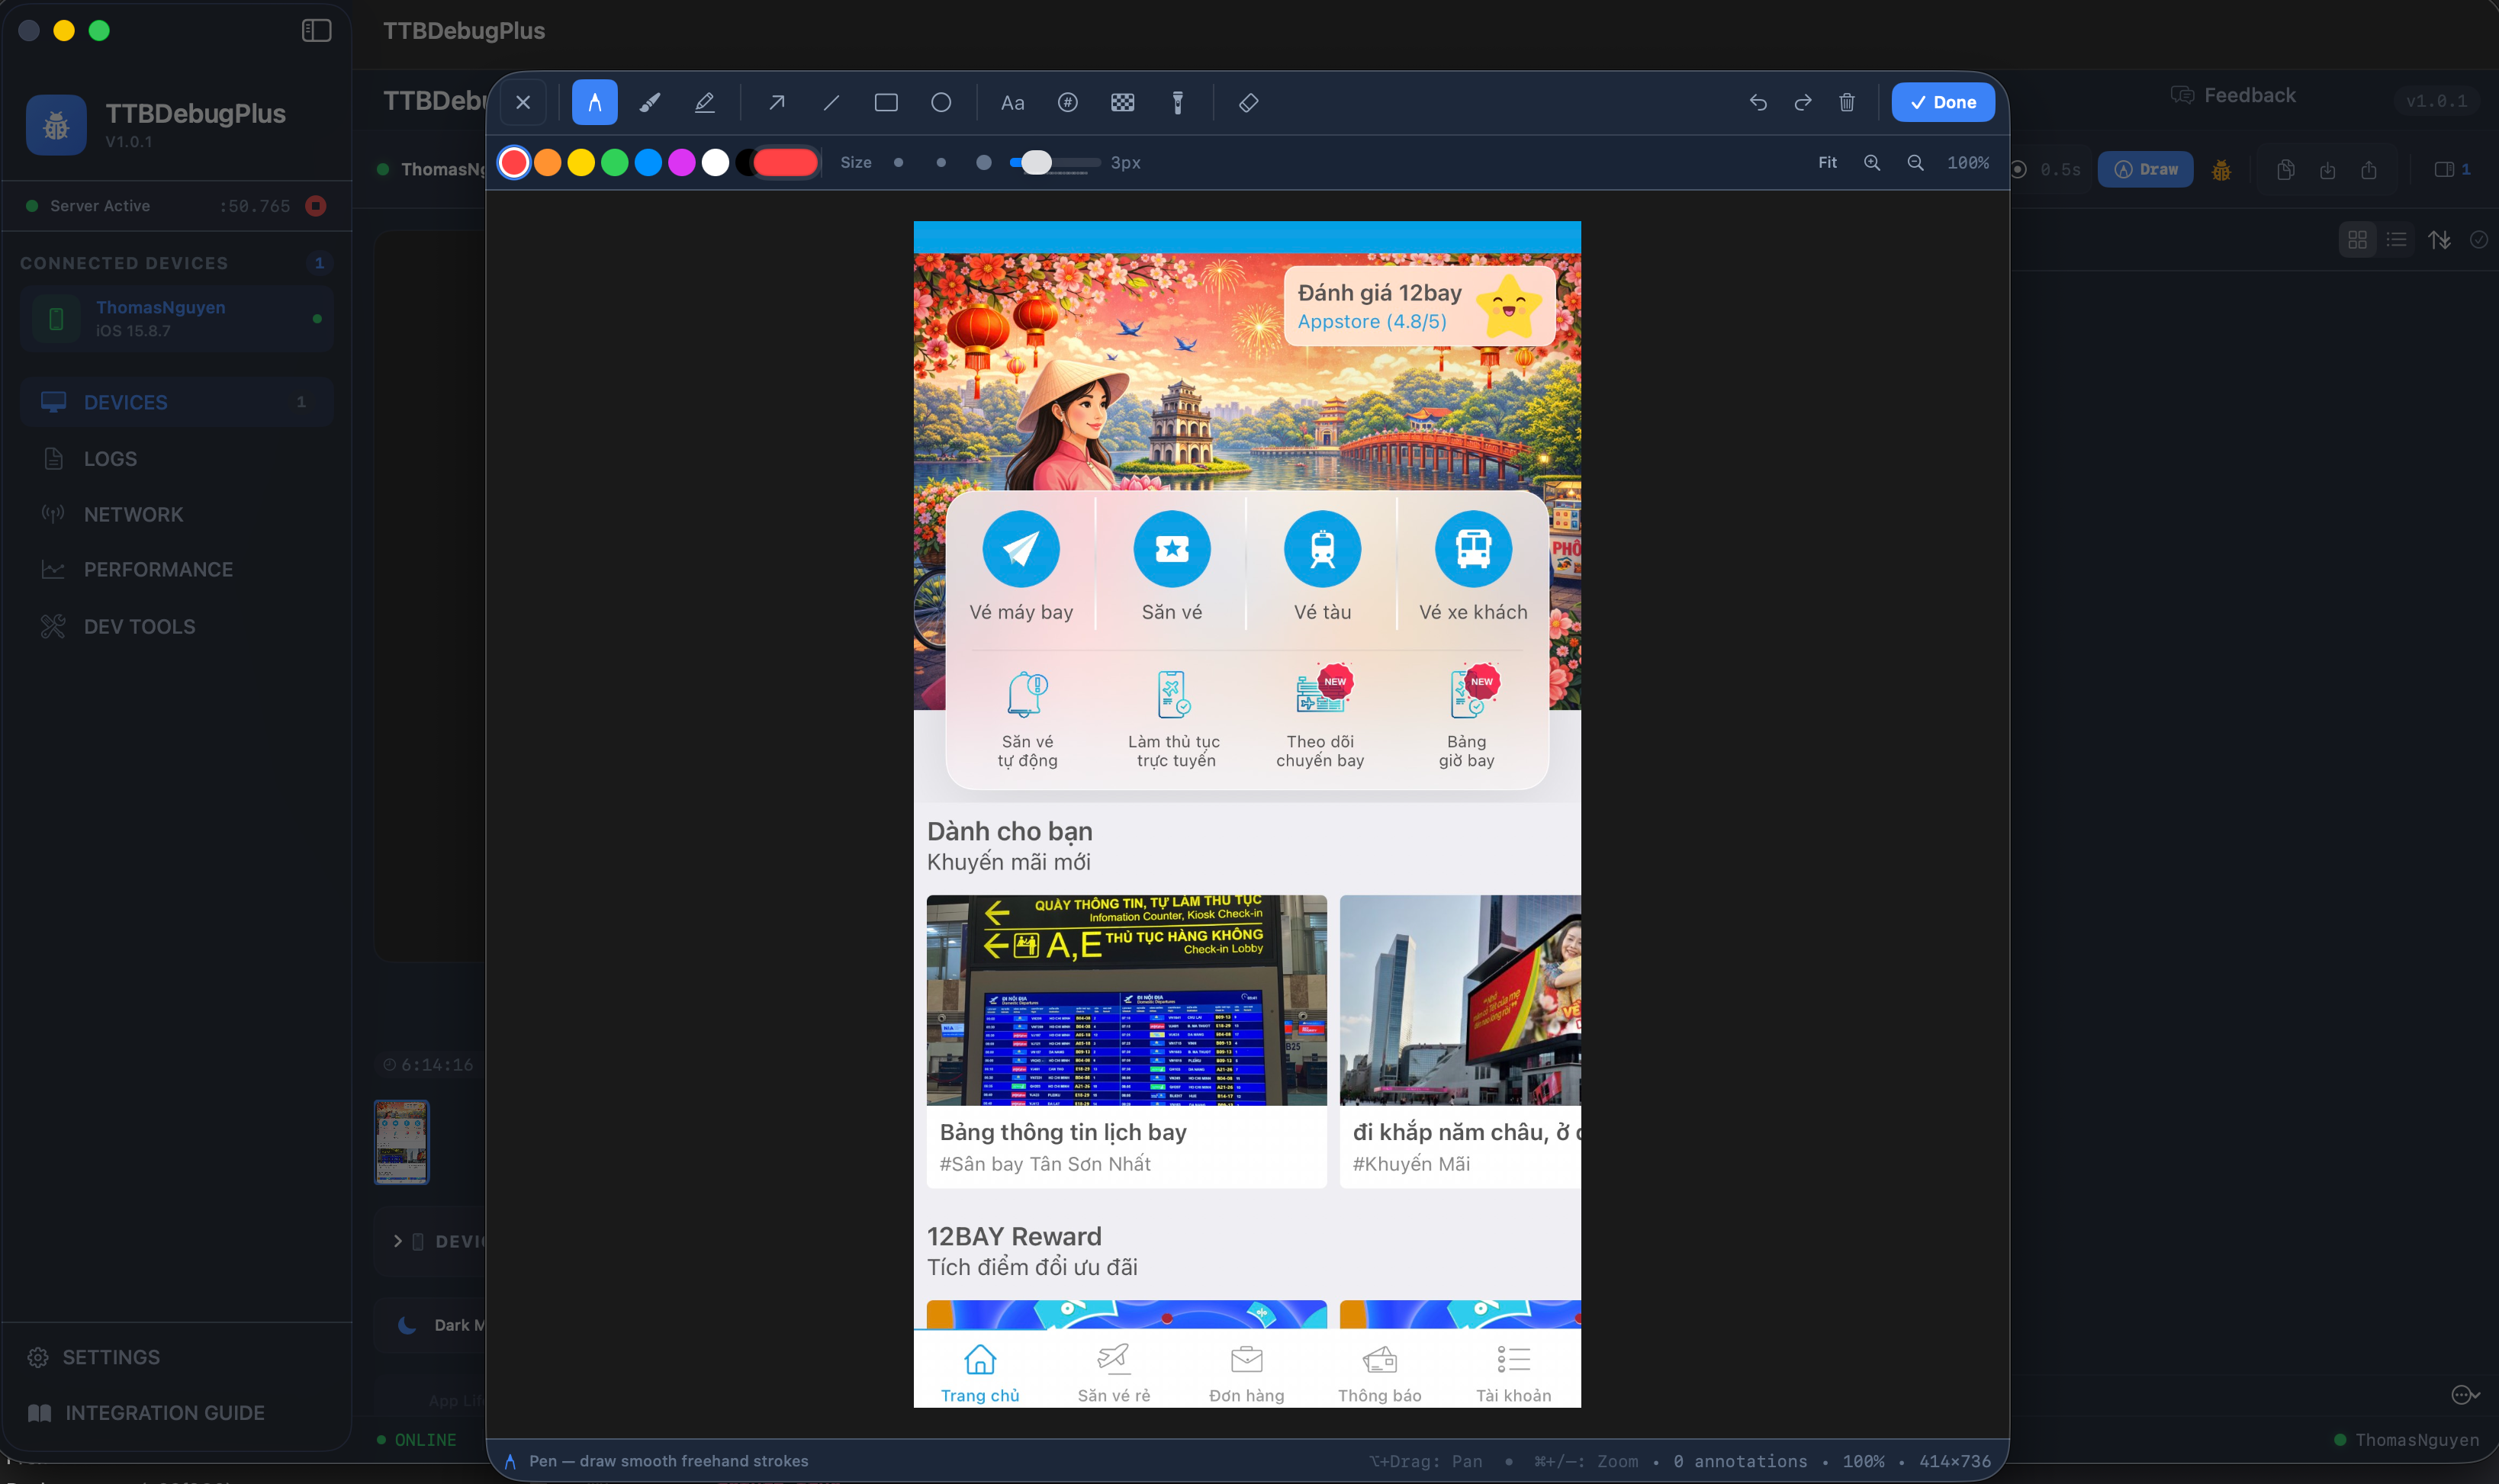
✏️ Screenshot Annotation
Full-screen drawing tools — pen, arrow, rectangle, text, color picker — annotate and share bug reports instantly.
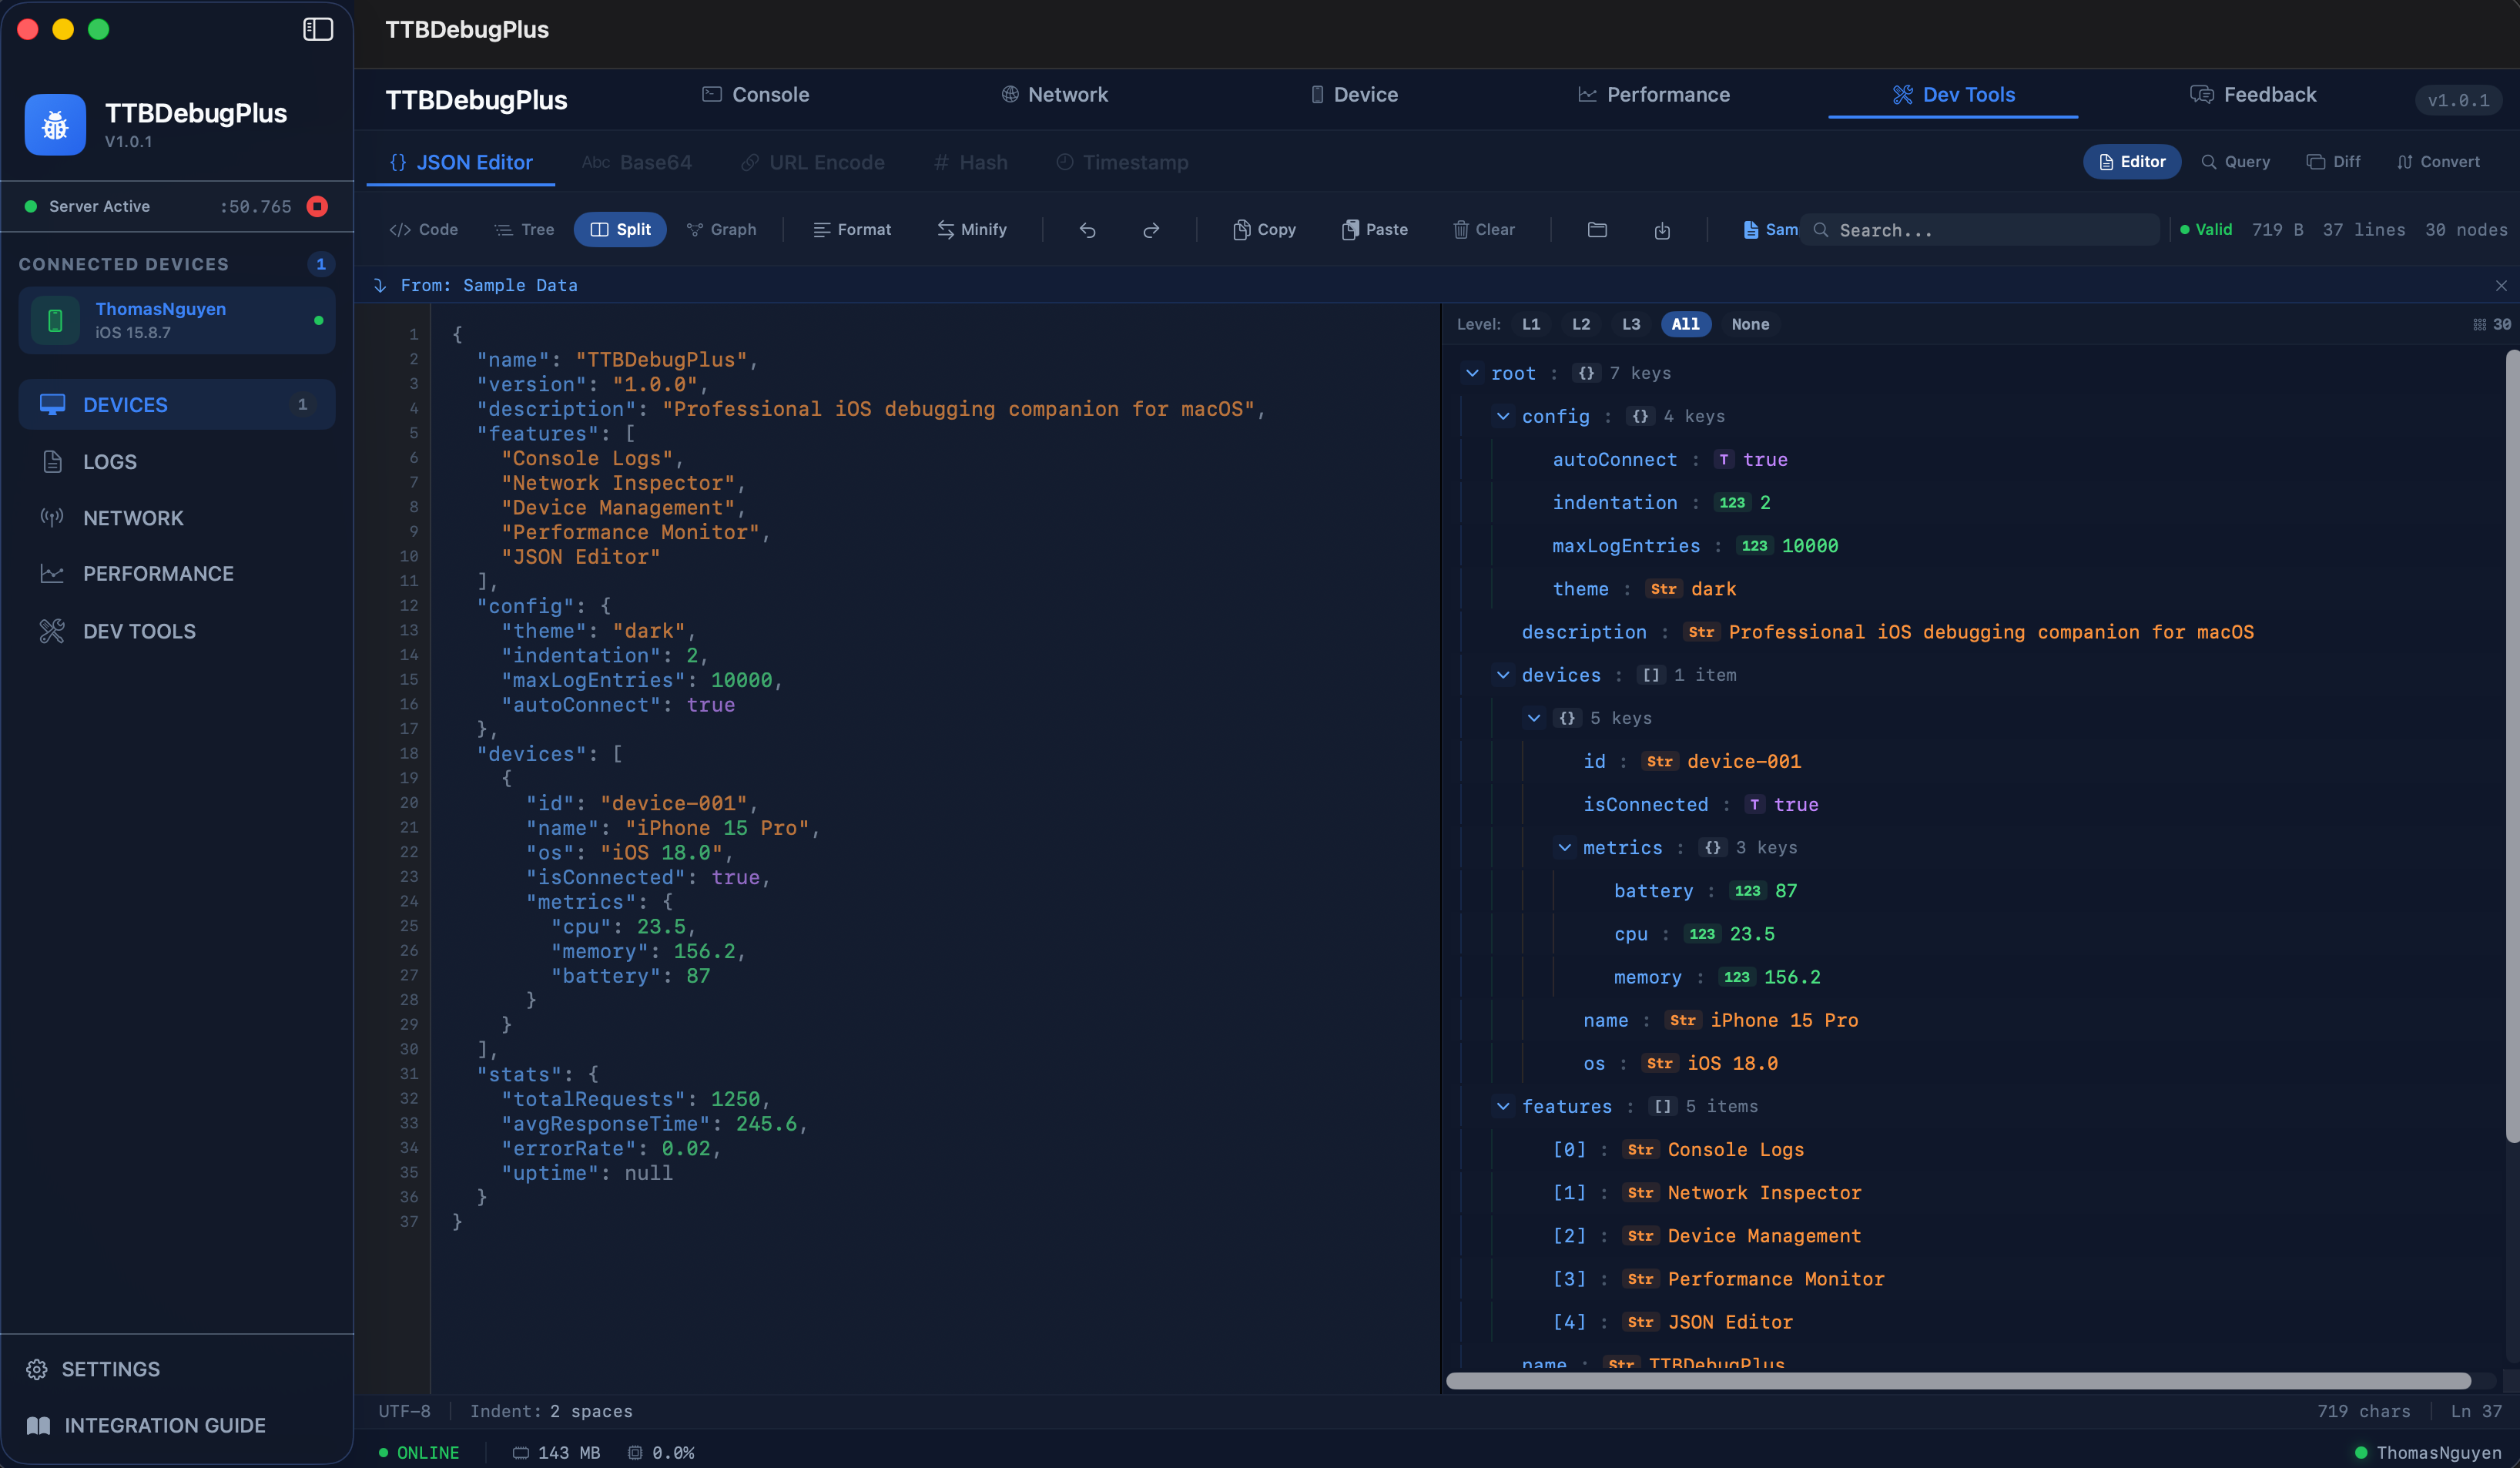
🛠 Dev Tools — JSON Editor
Professional JSON Editor with Code, Tree, Graph, and Split views. Syntax highlighting, search, format, minify, and diff.
iOS SDK Integration
Connect your iOS app to TTBDebugPlus macOS in minutes. The bridge auto-discovers the macOS app via Bonjour — no IP configuration needed.
⚡ Quick Start Overview
Ensure both devices (Mac + iPhone/Simulator) are on the same Wi-Fi network. Auto-connects in < 2 seconds.
Add TTBaseUIKit to Your Project
Add the TTBaseUIKit package which includes the DebugBridge module via Swift Package Manager.
// Swift Package Manager — add to Package.swift:
dependencies: [
    .package(
        url: "https://github.com/tqtuan1201/TTBaseUIKit.git",
        branch: "master"
    )
]

// Or add via Xcode:
// File → Add Package Dependencies...
// URL: https://github.com/tqtuan1201/TTBaseUIKit.git
// Branch: masterTTBaseUIKit/Support/DebugBridge/
⚠️ Configure Info.plist REQUIRED
iOS 14+ requires local network access declarations in Info.plist.
Missing this step causes "NoAuth -65555" error
when NWBrowser attempts Bonjour scanning.
<!-- Add to your iOS app's Info.plist -->

<!-- Required: Describe why local network access is needed -->
<key>NSLocalNetworkUsageDescription</key>
<string>Required for connecting to TTBDebugPlus
on macOS to stream debug logs.</string>

<!-- Required: Declare Bonjour service type -->
<key>NSBonjourServices</key>
<array>
    <string>_ttbdebug._tcp</string>
</array>Start the Debug Bridge
Initialize the bridge in your AppDelegate or
SceneDelegate.
Always wrap in #if DEBUG to exclude from production
builds.
import TTBaseUIKit

// AppDelegate.swift — UIKit
func application(
    _ application: UIApplication,
    didFinishLaunchingWithOptions launchOptions:
        [UIApplication.LaunchOptionsKey: Any]?
) -> Bool {

    // ── Setting for TTBaseUIKit ──
    let customView: ViewConfig = ViewConfig()
    let sizeConfig: SizeConfig = SizeConfig()
    let styleConfig: StyleConfig = StyleConfig()
    let paramConfig: ParamConfig = ParamConfig()

    TTBaseUIKitConfig.withDefaultConfig(
        withFontConfig: fontConfig,
        frameSize: sizeConfig,
        view: customView,
        style: styleConfig,
        params: paramConfig
    )?.start(
        withViewLog: EnvironmentsConfig.IS_DEV ? true : false
    )

    #if DEBUG
    DispatchQueue.main.asyncAfter(deadline: .now()) {
        // Optional: Custom configuration
        var config = TTDebugBridge.Config()
        config.heartbeatInterval = 3.0  // seconds
        config.maxBufferedMessages = 500
        TTDebugBridge.shared.config = config

        // Monitor connection state (safe to set — overlay uses NotificationCenter)
        TTDebugBridge.shared.onStateChange = { state in
            print("[Debug] Bridge state: \(state.rawValue)")
            // States: idle → browsing → connecting → connected
        }

        TTDebugBridge.shared.start()
        LogInterceptor.shared.install()
        TTDebugBridge.shared.showDiagnosticOverlay()
    }
    #endif

    return true
}

// Or SwiftUI App:
// @main struct MyApp: App {
//     init() {
//         let customView = ViewConfig()
//         let sizeConfig = SizeConfig()
//         let styleConfig = StyleConfig()
//         let paramConfig = ParamConfig()
//         TTBaseUIKitConfig.withDefaultConfig(
//             withFontConfig: fontConfig,
//             frameSize: sizeConfig,
//             view: customView,
//             style: styleConfig,
//             params: paramConfig
//         )?.start(withViewLog: EnvironmentsConfig.IS_DEV)
//
//         #if DEBUG
//         DispatchQueue.main.asyncAfter(deadline: .now()) {
//             var config = TTDebugBridge.Config()
//             config.heartbeatInterval = 3.0
//             config.maxBufferedMessages = 500
//             TTDebugBridge.shared.config = config
//             TTDebugBridge.shared.onStateChange = { state in
//                 print("[Debug] Bridge state: \(state.rawValue)")
//             }
//             TTDebugBridge.shared.start()
//             LogInterceptor.shared.install()
//             TTDebugBridge.shared.showDiagnosticOverlay()
//         }
//         #endif
//     }
// }Send API Logs
In your network layer, call sendAPILog to forward request/response data to the
macOS app. Data appears in the Network tab with JSON viewer,
waterfall timing, and export options.
// In your URLSession response handler:
#if DEBUG
TTDebugBridge.shared.sendAPILog(
    method: request.httpMethod ?? "GET",
    url: request.url?.absoluteString ?? "",
    statusCode: (response as? HTTPURLResponse)?.statusCode ?? 0,
    requestHeaders: request.allHTTPHeaderFields ?? [:],
    requestBody: String(
        data: request.httpBody ?? Data(),
        encoding: .utf8
    ) ?? "",
    responseHeaders: (response as? HTTPURLResponse)?
        .allHeaderFields as? [String: String] ?? [:],
    responseBody: String(
        data: responseData,
        encoding: .utf8
    ) ?? "",
    durationMs: elapsedTime * 1000,
    sizeBytes: responseData.count
)
#endif

// Or use LogInterceptor (if using LogViewModel):
#if DEBUG
LogInterceptor.shared.interceptAPILog(
    log, statusCode: statusCode,
    method: method, url: url,
    durationMs: duration
)
#endifSend Console Logs
There are 3 ways to forward console logs to macOS. Choose the one that best fits your codebase:
// ── Method 1: TTBPrint() — replaces print() ──
// Auto-sends to bridge + prints to console
TTBPrint("User logged in", level: "info", subsystem: "Auth")
TTBPrint("API error", level: "error", subsystem: "Network")

// ── Method 2: sendConsoleLog() — manual ──
#if DEBUG
TTDebugBridge.shared.sendConsoleLog(
    level: "debug",       // debug | info | warning | error
    subsystem: "Network", // module name
    message: "User profile loaded successfully",
    sourceFile: #file,
    sourceLine: #line
)
#endif

// ── Method 3: LogInterceptor — hook existing calls ──
#if DEBUG
LogInterceptor.shared.interceptConsoleLog(
    message: "Something happened",
    level: "warning",
    subsystem: "Analytics"
)
#endifTTBPrint() instead of print() — auto-sends to macOS + prints to
Xcode console.
Run & Verify Connection
Ensure both devices are on the same Wi-Fi network, open TTBDebugPlus on Mac, then Build & Run your iOS app. TTBDebugPlus auto-discovers the device within seconds.
// ✅ iOS Xcode Console will show:
// [TTDebugBridge] 🔍 Started browsing for debug services...
// [TTDebugBridge] 📡 Found service: xxx._ttbdebug._tcp.local.
// [TTDebugBridge] ✅ Connected to macOS app!

// ✅ TTBDebugPlus macOS will show:
// [TTBDebug] 🚀 Connection manager started
// [TTBDebug] ✅ Bonjour advertiser ready on port 50689
// Sidebar: iPhone appears with name + version

// (Optional) Monitor connection state:
TTDebugBridge.shared.onStateChange = { state in
    print("[Debug] Bridge state: \(state.rawValue)")
    // States: idle → browsing → connecting → connected
}

// (Optional) Advanced configuration:
var config = TTDebugBridge.Config()
config.heartbeatInterval = 5.0  // seconds (default)
config.maxBufferedMessages = 200 // buffer when offline
config.reconnectMaxDelay = 30.0  // max reconnect delay
TTDebugBridge.shared.config = config📋 Complete Working Example
Copy the complete setup code below into your AppDelegate. This is the minimal full setup for a new iOS app:
import UIKit
import TTBaseUIKit

@main
class AppDelegate: UIResponder, UIApplicationDelegate {

    func application(
        _ application: UIApplication,
        didFinishLaunchingWithOptions launchOptions:
            [UIApplication.LaunchOptionsKey: Any]?
    ) -> Bool {

        // ── Setting for TTBaseUIKit ──
        let customView: ViewConfig = ViewConfig()
        let sizeConfig: SizeConfig = SizeConfig()
        let styleConfig: StyleConfig = StyleConfig()
        let paramConfig: ParamConfig = ParamConfig()

        TTBaseUIKitConfig.withDefaultConfig(
            withFontConfig: fontConfig,
            frameSize: sizeConfig,
            view: customView,
            style: styleConfig,
            params: paramConfig
        )?.start(
            withViewLog: EnvironmentsConfig.IS_DEV ? true : false
        )

        #if DEBUG
        DispatchQueue.main.asyncAfter(deadline: .now()) {
            // Optional: Custom configuration
            var config = TTDebugBridge.Config()
            config.heartbeatInterval = 3.0  // seconds
            config.maxBufferedMessages = 500
            TTDebugBridge.shared.config = config

            // Monitor connection state (safe to set — overlay uses NotificationCenter)
            TTDebugBridge.shared.onStateChange = { state in
                print("[Debug] Bridge state: \(state.rawValue)")
                // States: idle → browsing → connecting → connected
            }

            TTDebugBridge.shared.start()
            LogInterceptor.shared.install()
            TTDebugBridge.shared.showDiagnosticOverlay()
        }
        #endif

        return true
    }
}

// In your network layer — forward API logs:
// #if DEBUG
// TTDebugBridge.shared.sendAPILog(
//     method: "GET", url: "...",
//     statusCode: 200, durationMs: 123
// )
// #endif

// Replace print() with TTBPrint():
// TTBPrint("Hello", level: "info", subsystem: "App")
Keyboard Shortcuts
Power-user shortcuts for maximum productivity.
| Shortcut | Action |
|---|---|
| ⌘ 1–5 | Switch tabs: Console, Network, Device, Performance, Feedback |
| ⌘ K | Clear console logs |
| ⌘ F | Focus search field |
| ⇧ ⌘ C | Capture screenshot from iOS device |
| ⇧ ⌘ E | Export current debug session (.ttbdebug) |
| ⇧ ⌘ I | Import debug session from file |
| ⌘ , | Open Settings |
| ⌘ ? | Open Integration Guide |
Troubleshooting
Common errors during integration, with root cause explanations and step-by-step fixes.
🛡️ NoAuth (-65555) — Missing Local Network Permission
NSLocalNetworkUsageDescription
and NSBonjourServices
in Info.plist.
If missing, NWBrowser is immediately blocked by the system with error code
-65555.
📶 posixError(57) — Socket Connection Failed
📱 iOS app not appearing on macOS sidebar
_ttbdebug._tcp
but iOS cannot find it. Common causes: different Wi-Fi network, iOS hasn't called start(),
or Local Network permission was previously denied.
🔄 Frequent Connection Drops
🌙 App went to background — Bridge paused
🔒 Ensuring it doesn't leak into release builds
#if DEBUG ... #endif
so the compiler strips it entirely from the binary.
Download TTBDebugPlus
Get the macOS companion app. No account needed, no subscription — just download, install, and start debugging.
TTBDebugPlus for macOS
macOS 14+ • Universal (Apple Silicon + Intel) • 5.8 MB1. Download
Click the button above to download the .dmg installer file
2. Install
Open the DMG, drag TTBDebugPlus to your Applications folder
3. Launch
Open TTBDebugPlus from Applications. It sits in the menu bar ready to go
Open Source
TTBDebugPlus is fully open source. Explore the codebase, contribute features, report issues, or fork it to build your own debugging tools.
tqtuan1201/TTBDebugPlus
macOS Companion Debugger for iOS Apps — SwiftUI • Swift🚀 Best Practice
Run First, Read Code Later
The fastest way to understand TTBDebugPlus is to experience it. Download both apps, run side-by-side, then explore the code.
Download macOS App
Get the TTBDebugPlus macOS companion app. This is the "receiver" that shows all debug data from your iOS app.
Clone Sample Project
Clone TTBaseUIKit repo — includes a ready-to-run example app with TTDebugBridge pre-configured.
git clone https://github.com/tqtuan1201/TTBaseUIKit.git
cd TTBaseUIKit/Example
open TTBaseUIKit.xcworkspace
⚡ 3-Minute Quick Run
1. Launch macOS App
Open from Applications
2. Run iOS Example
Build & Run on same Wi-Fi
3. Explore & Learn
Watch logs, then read code
Ready to Debug Smarter?
TTBDebugPlus is included with TTBaseUIKit. Download the macOS app, add the SDK, and start debugging in under 5 minutes.